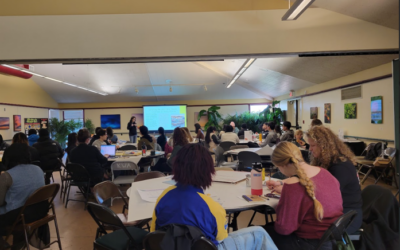
12 amazing teachers spent the week of June 21-25 engaged in a teacher/scientist partnership. The goal of the TSP program is to have scientists share their expertise to deepen the teacher’s understanding of the content and learn a little more about how scientists at Pacfic Northwest National Laboratory ( PNNL) approach solutions oriented thinking in their work.
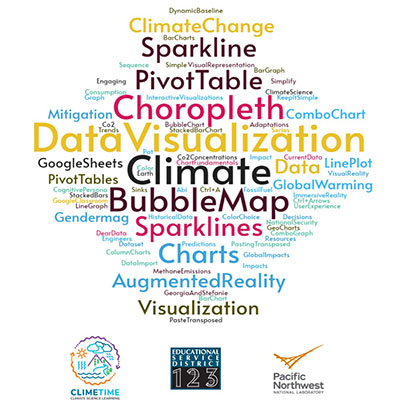 The focus of this TSP included two areas of content. The first was climate change and the second was the power of data visualizations to convey with communities. Several climate scientists spoke with teachers about how we know changes in our climate are impacting communities all over Washington State and the world. Nick Cramer, a software engineer spent the entire week supporting teachers in learning, creating, using data to design visualizations such as choropleths, pivot tables, bar charts, stacked bars, and bubble maps.
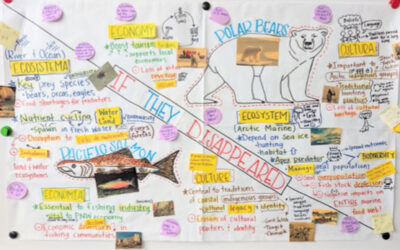
As the teachers deepened their understanding of climate change, designed visualizations, they were engrossed in the power of data as they worked to answer these driving questions. How have human activities combined with natural processes contributed to a rise in global temperatures over the past century? How can we communicate evidence of climate change to convince our community to act? Teachers selected a community that has been affected by climate change, researched impacts, and sourced data, and created data visualizations to convene the urgency of climate change. On Friday, the teacher teams presented their case for climate change to a panel of scientists from PNNL. The quality of the presentations in the data visualizations and the impact of climate change blew the scientist away. So much had been learned in 5 days!
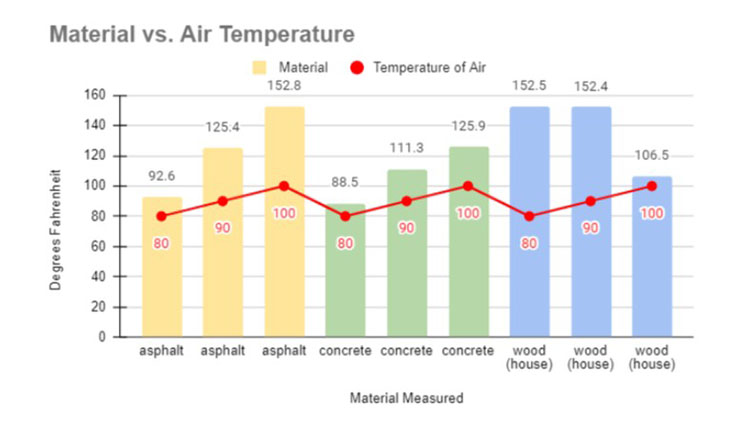
Example data visualization
When we asked teachers, what is the greatest takeaway from your TSP experience, Vaughn Uber, a teacher from Othello said, “The importance of properly using data visualizations and the power they can bring to teaching.” Tina Brewer, a teacher in Kennewick said, “My biggest take away was that magnitude of climate change and all the pieces of the puzzle. This experience helped me to see myself as a critical part of the change that needs to happen.”
The impact of Teacher Scientist Partnership is of great value for the students in our classrooms. Jessica Saddler commented, “ I jokingly said to my team that this was the STEM training I may not have wanted but definitely needed. The training was really helpful to me in developing some technology skills that will help me in the future to better reach my students and work more effectively. I learned so much about how to actually convert data into a more usable format and I think that this will be really beneficial to my students when analyzing and interpreting data. This will also allow me to reach a wider variety of learners as we work through the standards related to data because I believe this will really help to differentiate and reach students with a variety of learning needs because it can be made so visual.”
The teachers also began lesson planning on how they will bring Climate Data and Visualizations to the students. Keziah Watson gave a great example of her plans when she shared, “We are already planning some long term STEAM projects at my building involving renewable energy and restorative practices, so I feel like this week helped add a whole other level of meaningful connection. I was able to build in more data visualization activities and to connect part of our projects to the larger theme of climate science.
The week spent with scientists was rigorous and full of potential for our teachers and students!