What was tried in the classroom?
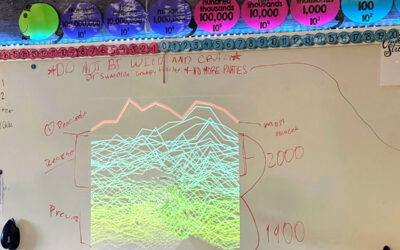
We read books and held discussions. We also did a input chart and did a classroom experiment to weight our classroom food waste.
How’d it go?
Students were very engaged and want to learn more.
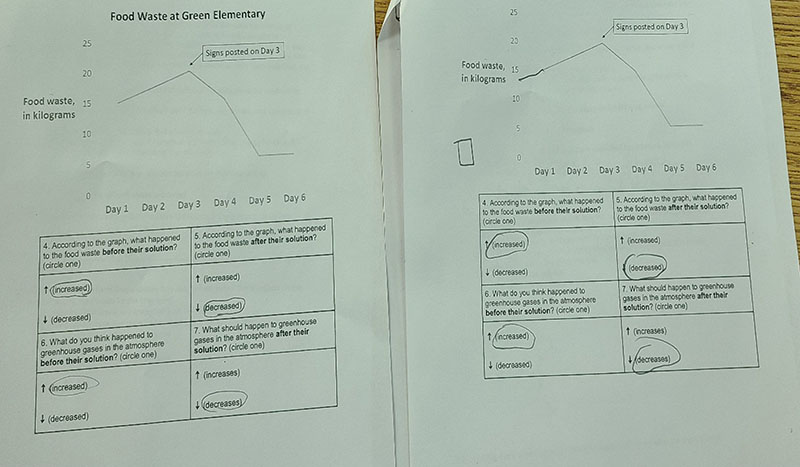
Food Waste at Green Elementary
Students learn about food waste
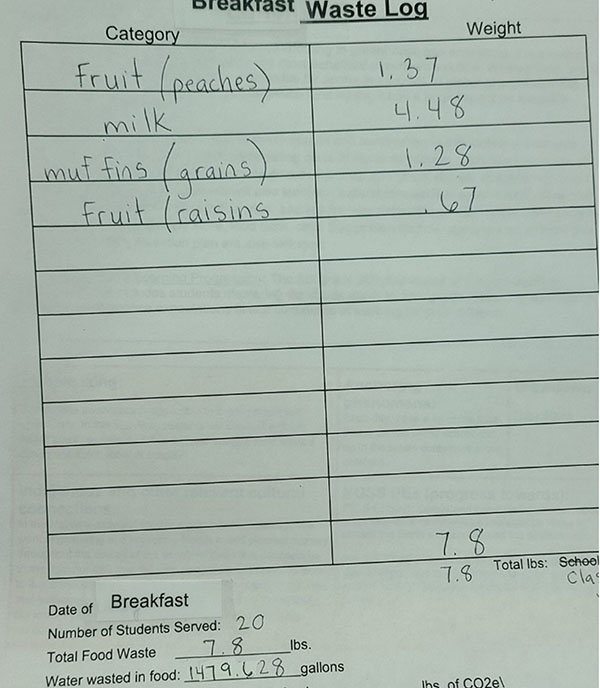
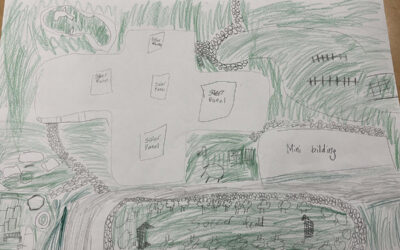
Breakfast Waste Log
Food waste weighting exercise
ClimeTime Training
STEM Seminar: A Taste of Food Waste
Classroom
School: Barge Lincoln Elementary
District: Yakima School District
Teacher: Edelia Rodriguez