Analyzing & interpreting data
a canvas course for Washington teachers

Overview
Teachers across Washington state expressed that they wanted to better understand how to interpret climate science data before leading classes with their own students. In order to reach a broad range of teachers, ESD 113 developed and launched an online course in January 2020. The ESD team hoped to engage more rural and remote teachers, as well as teachers from schools identified to receive support for improvement. This course provided a free platform that fostered learning communities among science educators across Washington State.
What We Did
In December 2019, project leads recruited teachers to join the first Canvas Course cohort, prioritizing districts that are targeted for the Washington School Improvement Framework (WSIF). Once these districts were given the opportunity to join, the course was opened up to all teachers across the State. Ultimately 190 teachers across two cohorts completed the class. One cohort took and completed the course in January and the other in February. Teachers were given a stipend to compensate them for their time.
The course consisted of five online modules and fifteen lessons, starting with teachers analyzing and interpreting Climate Science data themselves before preparing lessons for their students. Four Emeritus Fellows, teachers who participate in the WA State Fellows’ Network, served as moderators, engaging teachers in discussions, providing guidance and sharing additional resources to extend participants’ learning. This virtual collaboration allowed teachers to engage without judgment on grade level, providing a sense of camaraderie.
The course provided lesson plans and facilitator guides for teachers to implement in their own classrooms during the month. They had the opportunity to continuously engage with other teachers, learning from each other’s successes and challenges. Teachers shared their students’ work in real time, highlighting observations and challenges and asking for feedback from their peers. These student samples also helped inform future cohort’s lessons plans, which were revised after the February cohort.
What We Learned
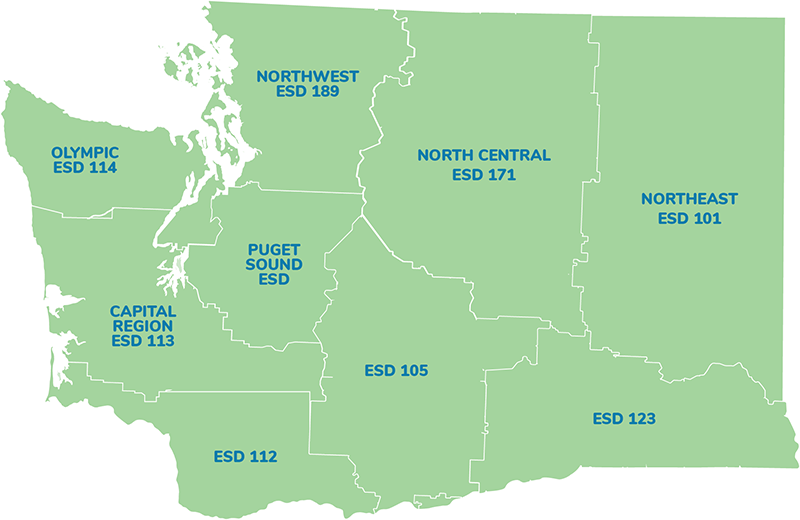
Offering online learning allowed teachers across the State to learn together and let the ESD reach a broader range of teachers in different contexts. ClimeTime proviso resources were managed so that any educator could take virtual courses offered in any ESD. Scott Killough, the course instructor, shared that a teacher can be two and half hours away and still be interacting with other teachers, site coordinators, NGSS moderators, and classmates. This can improve equity for high quality professional learning particularly for rural teachers who rarely have such opportunities. Teachers appreciated the opportunity to work at their own pace and in their own time:
I work full time teaching, have three children of my own, and a house and yard to maintain. I love being able to take classes and learn, but those dates and times need to be flexible.
Additionally, this project gave teachers the confidence to lead students in analyzing and interpreting climate science data. The Canvas Course created a space for teachers to practice engaging with data themselves and reflect on the strengths and challenges of bringing their learning to the classroom:
…I think it was my first online course and wasn’t sure how I would feel about it. I was grateful for the background knowledge of this course into the Science and Engineering Practices and the reminder of using them in my kindergarten classroom. … I think this class gave me a new motivation to bring out science and engineering practices on a weekly basis. I was also challenged by this class and others from the class to use science and math together. … I will take a few nuggets away from this class and use them in my kindergarten classroom to allow my students to have more opportunities to be exposed to science and engineering.

Project Reach
Teachers
Students
Project Partners

Feedback
…[The project] opened my eyes to how much help and support [students] really need when they analyze and interpret graphs. … I’m now implementing an activity every week where we will look at graphs and discuss what they represent and how to think critically about them. I’ve used the NY Times ‘What is Going on in this Graph?’ the last three weeks now and my students are getting better already with their ‘I notice’ and ‘I wonder’ statements.
Contact
For more information contact:
Scott Killough, Regional Science Administrator, ESD 113
skillough@esd113.org
